
Overview
A common problem when starting a new project is getting fixtures in place to facilitate testing of reporting functionality and refining data models. To ease this, I've created a PDI job that creates the dimension tables, and populates a fact table.
My inspiration is from a variety of sources (for example the CDG project from Webdetails).
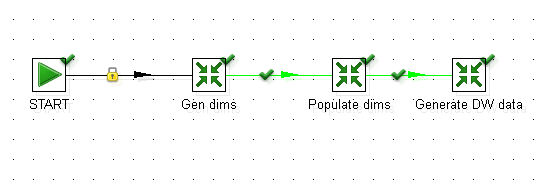
Here is the job that controls everything. It doesn't do anything special except link the transformations to each other.
Next up, the dimension data generator transformation.

This transformation creates a template JSON document which is parsed and used in other steps, as well as defines the size of the date dimension and the start date. Here is the step by step breakdown.
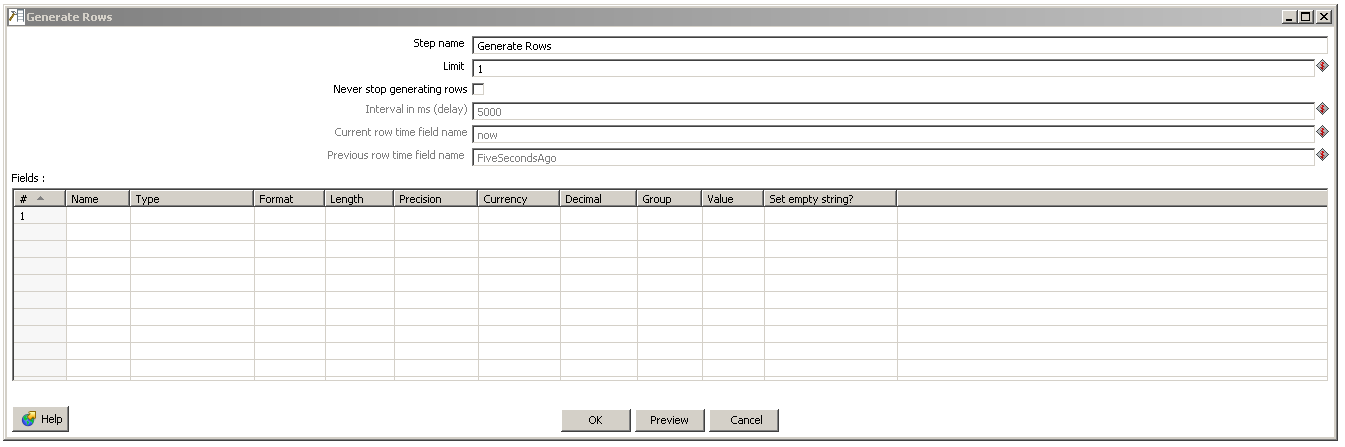
To start, we generate a dummy row to kick off the transformation.
The following step is where all the dimensions are defined (might need to zoom this image a bit to see the text). We're defining a JSON structure in here that contains all the data we'll need later on for both populating the fact table as well as creating the dimensions.

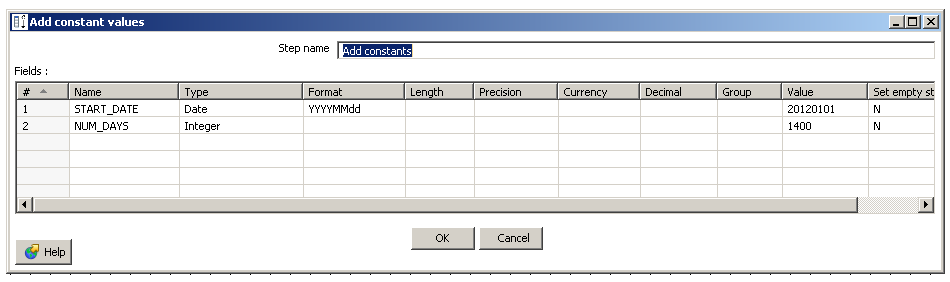
Once the data is serialized, the remaining steps configures the start date and number of days, then passes this information along to the next transformation.
Next up, we've got the dimension populator transformation.
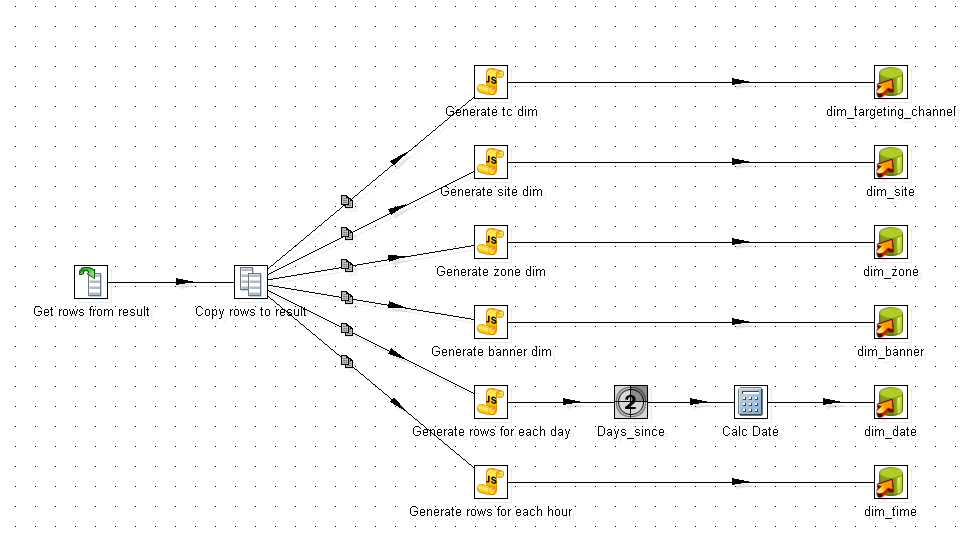
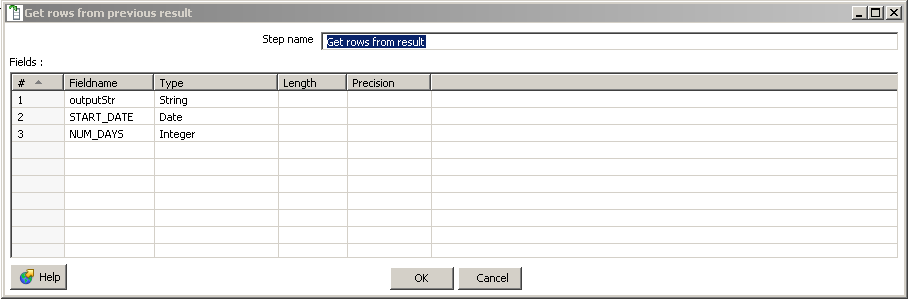
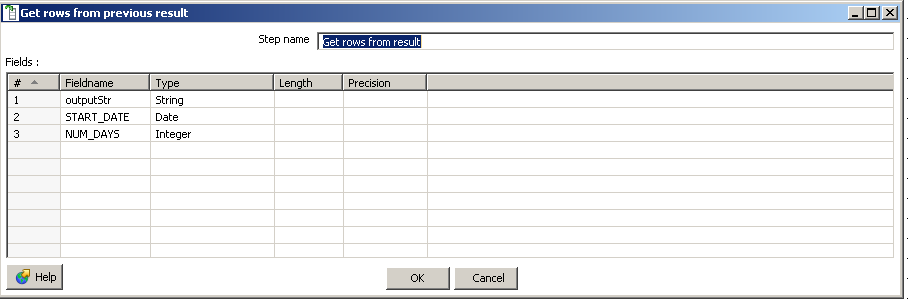
Grab the input rows from previous transformation.
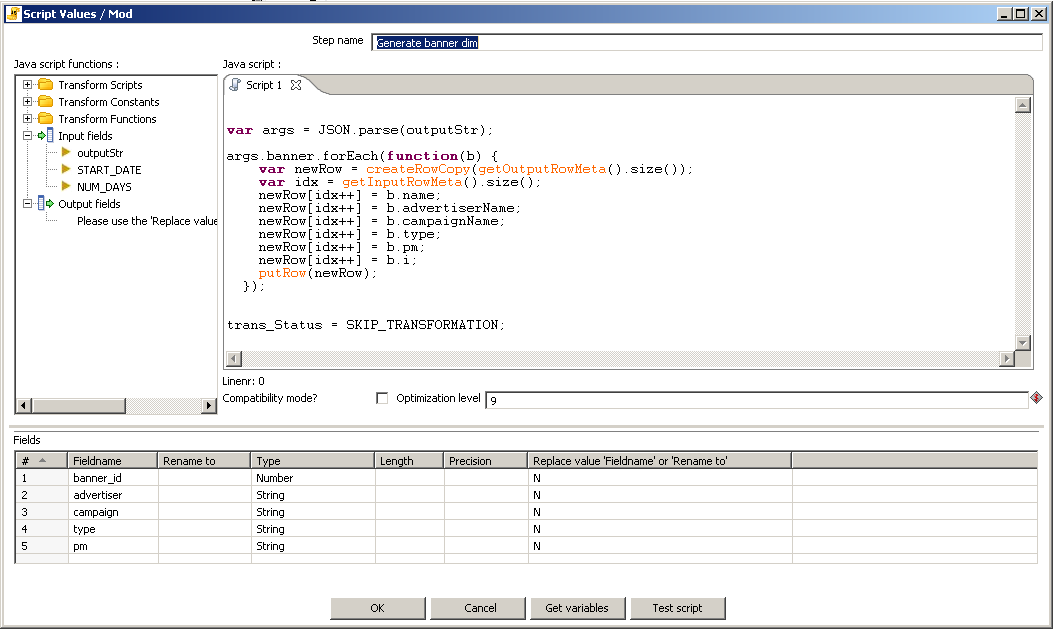
Here is what the dimension generator looks like. As you can see, there's one of these steps for each dimension. In the example I've posted, I'm creating a dimension that contains a hierarchy with several levels.
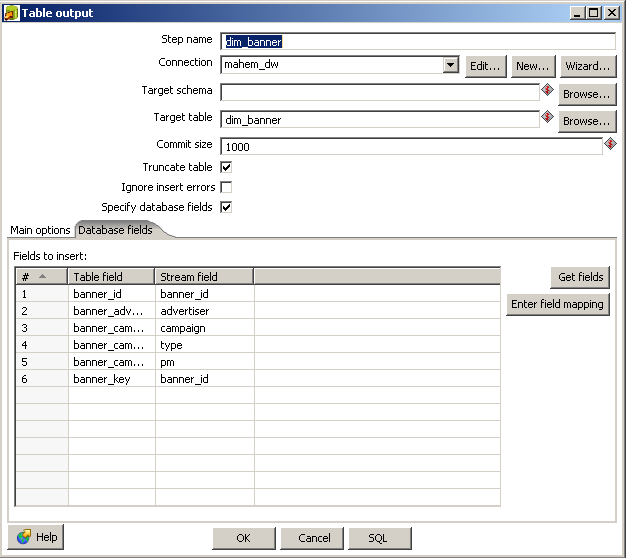
Then we save the dimension data to the database
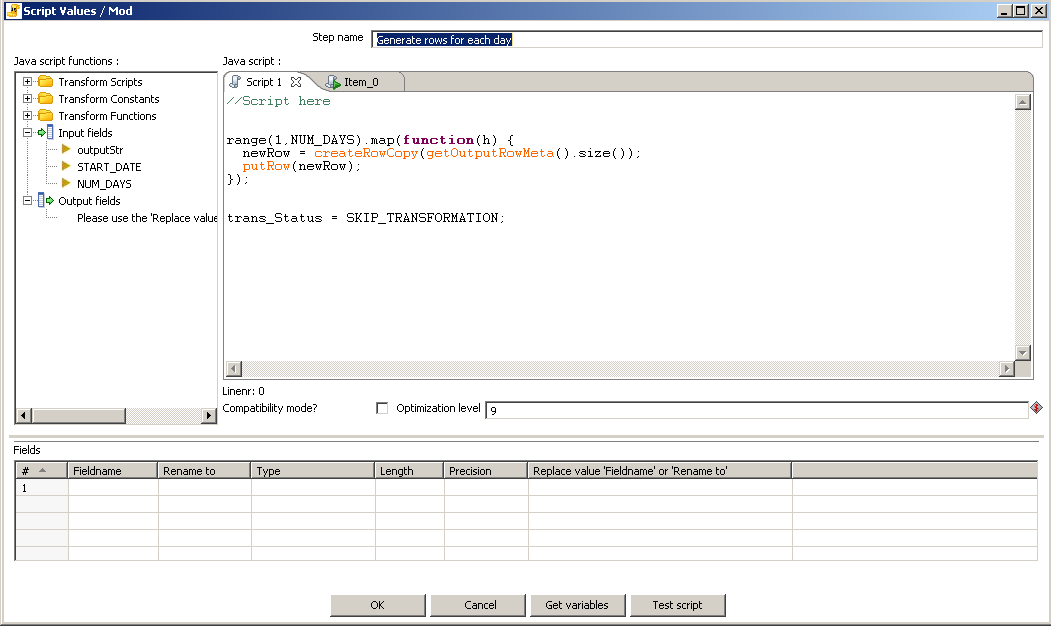
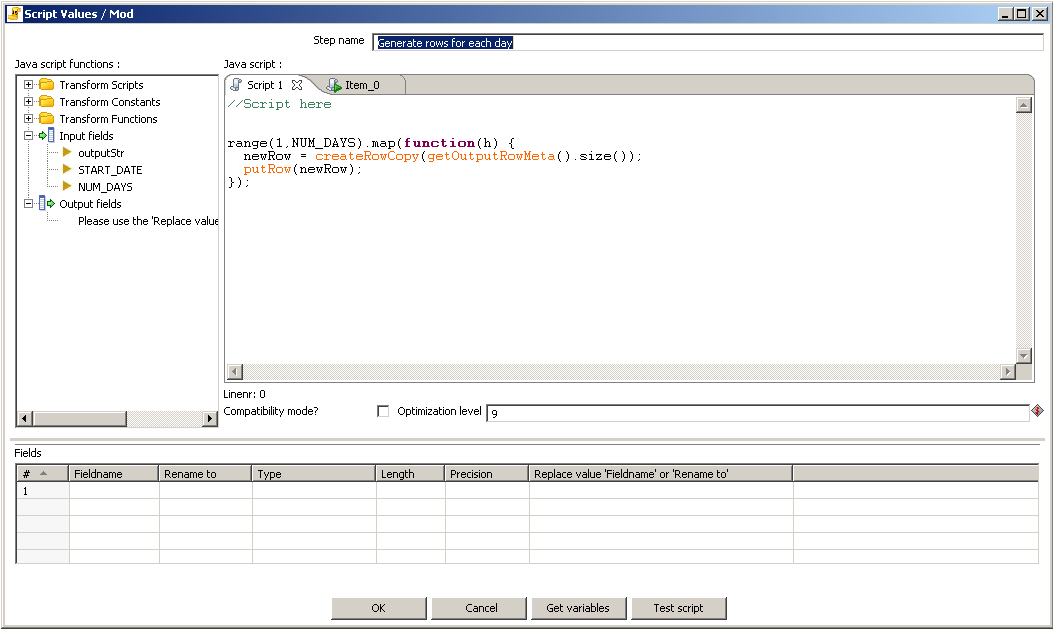
For the date and time dimensions, we do things slightly differently. To generate all the dates in the range requested, we kick off a javascript step that generates empty rows, one for each day requested.
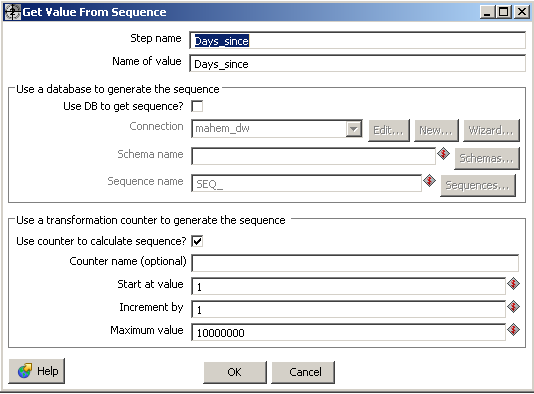
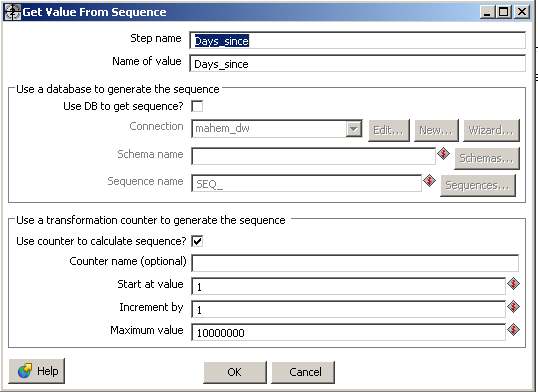
We create a sequence, which is going to be our technical key later on. It represents the number of days since the first day generated.
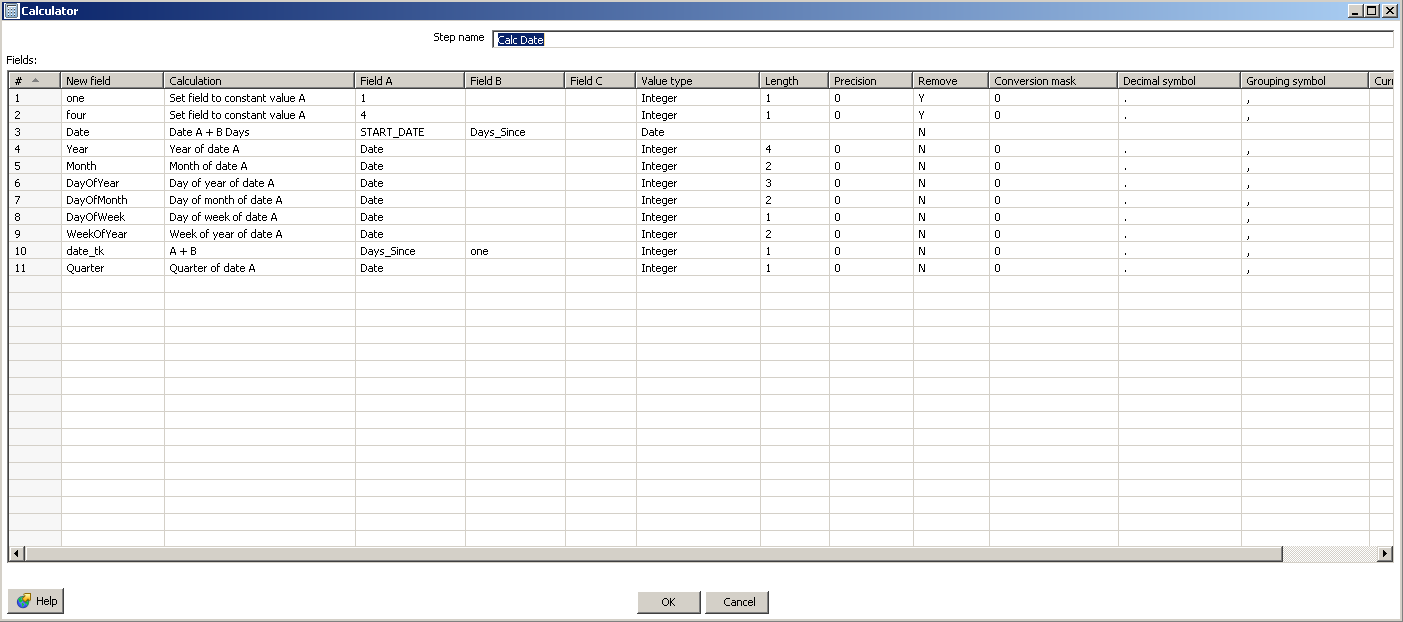
We next do some date math to enrich our working set a bit. In my date dimension, I'm actually not using all of these, but it's handy to have them around.

Finally we output to the dimension table.

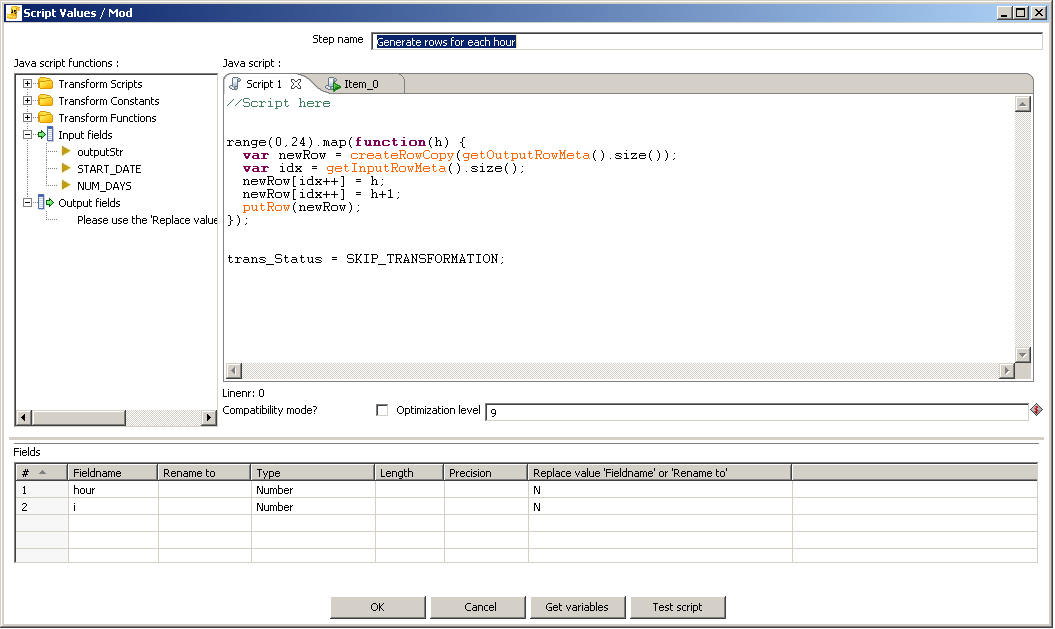
Similarly for time, we generate one row for each hour of the day.
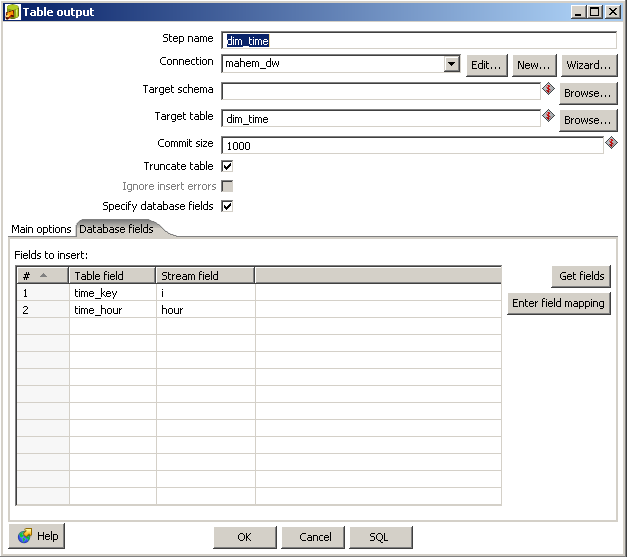
And save it to the dimension table.
Finally, we have the transformation to populate the fact table.
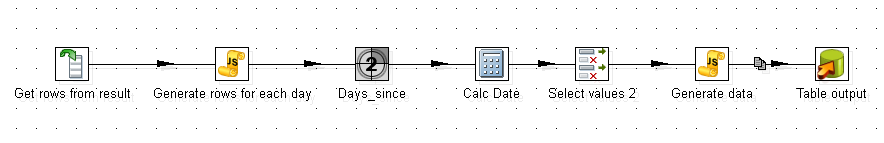
Grab the input rows from the previous transformation.
Generate a series of days in the range requested.
Create a sequence.
Do some date math.
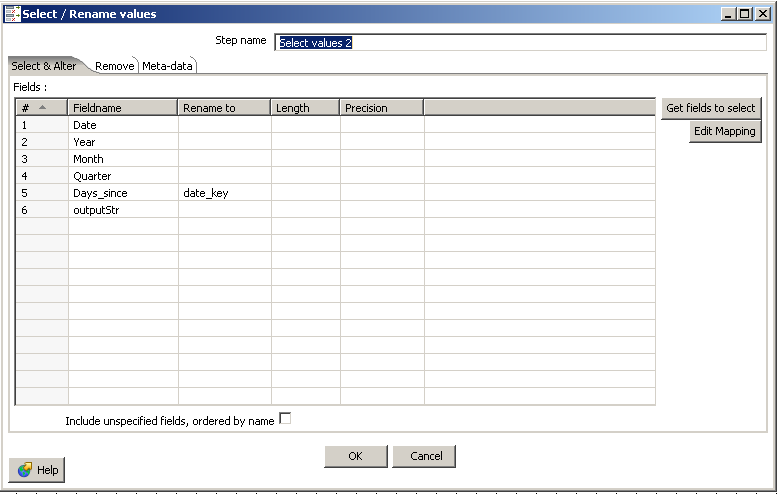
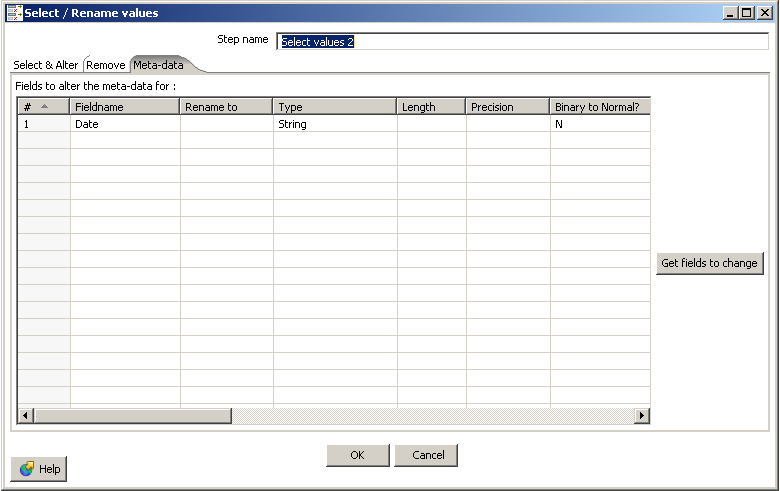
Metadata cleanups
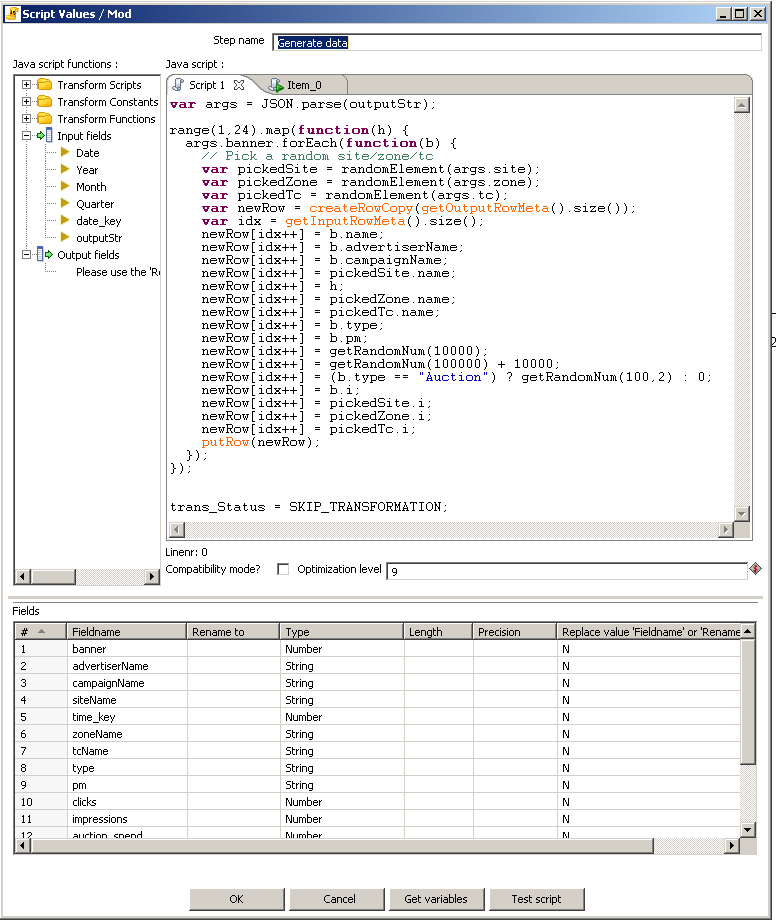
Generate row data for each dimension. So I've chosen to generate data for every hour of every day in the requested date range as well as for one of the dimensions (banner in this case).
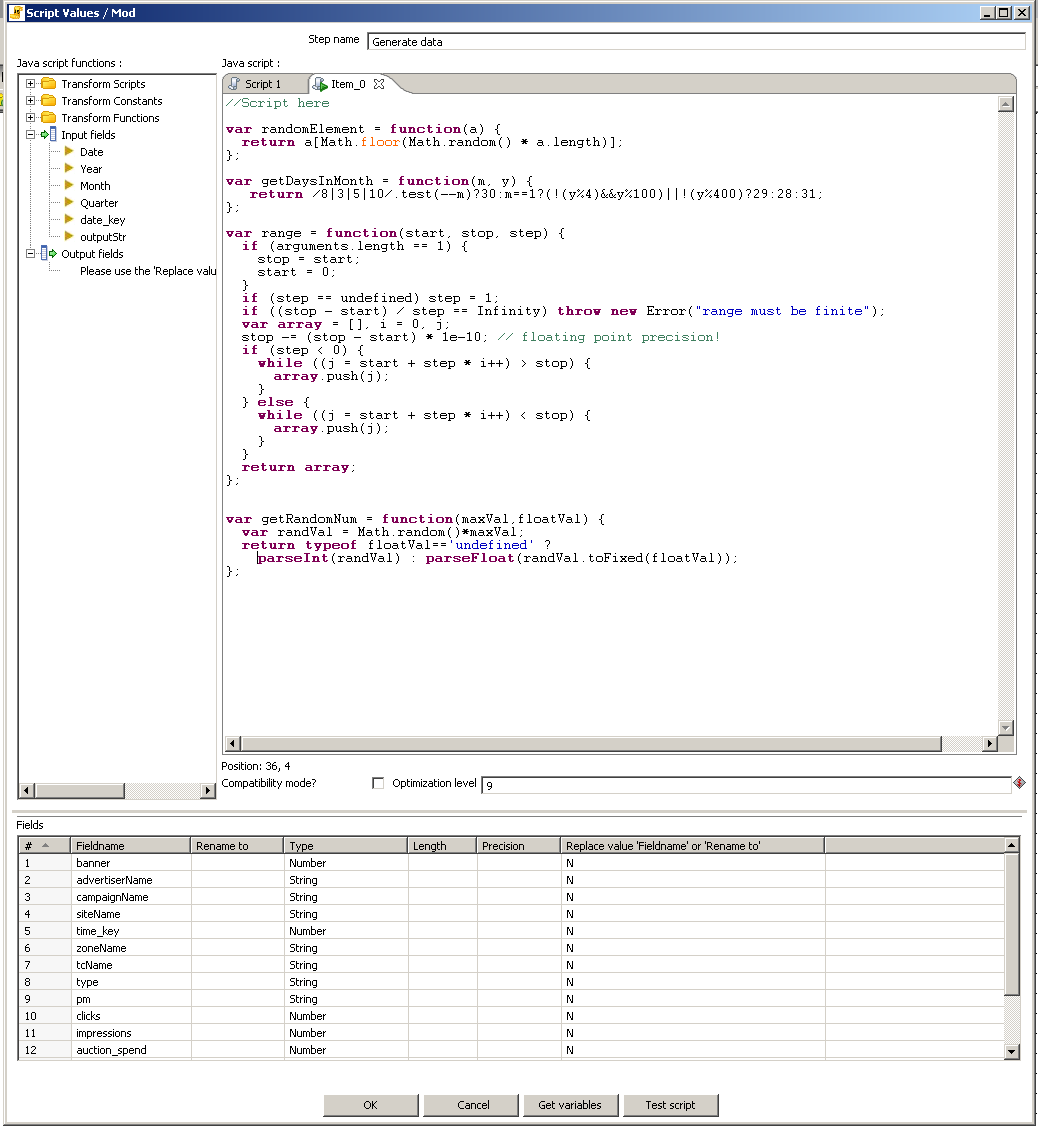
Here's the second (start) javascript script on that step.
Closing thoughts
The above approach obviously requires a bit of copy pasta and customization to get it working for a particular use case.
I would have liked to completely automate the creation of dimensions and data generation based on the json schema, but
that requires to add extra information in the JSON structure (to model the hierarchies and levels). In a similar vein,
it would have been nice to abstract away the data generation to make it plug and pray with no customizations, but I don't
know if the javascript API exposes the necessary PDI hooks to do everything, and I'm too lazy to write this in Java.